 26Sep

Battery depth of discharge (DoD) is the percentage of a stated battery capacity that has been used. A bigger battery label can still leave you with less usable energy. The allowed window may be smaller.
That matters when you compare solar storage with an uninterruptible power supply (UPS). The same label can hide different limits, reserve settings, and test conditions. A charge display adds another number. It’s easy to mix up what you’ve used with what you still have.
Those numbers need to agree before you judge runtime or cost. This guide explains battery depth of discharge through worked calculations, manufacturer guidance, and practical questions for suppliers. You’ll learn how it relates to state of charge, how test conditions affect cycle life, and where usable capacity is measured.
The examples use stated inputs, not promised product results. We’ll start with the percentages, compare lead-acid and lithium guidance, then apply the result to daily storage and UPS duty. If you’re still choosing a technology, start with our storage battery selection guide.
Key Takeaways
- At 80% DoD, 20% state of charge remains when both use the same capacity reference.
- Discharging from 90% to 30% charge uses a 60-percentage-point window, not an 80% window.
- Trojan recommends 50% or less discharge in its lead-acid maintenance guidance; the exact battery manual still governs selection.
- Victron lists 2,500 cycles at 80% DoD for its LFP-Smart family, with an endpoint of at least 80% nominal capacity.
- A 10 kWh battery across a 60% window provides an estimated 6 kWh DC before conversion losses, aging, and other allowances.
Battery depth of discharge: what the numbers mean
Used capacity versus state of charge
Battery depth of discharge measures the share drawn from a stated full capacity. State of charge (SoC) measures the share remaining. With the same reference, DoD plus SoC equals 100%.
Neither value alone proves how much power you can draw. Nor does it prove how long your load will run.
| DoD below full | State of charge remaining | Meaning for a 100 Ah reference |
|---|---|---|
| 0% | 100% | No charge withdrawn from full |
| 30% | 70% | 30 Ah withdrawn |
| 50% | 50% | 50 Ah withdrawn |
| 80% | 20% | 80 Ah withdrawn |
Keep the two uses of DoD separate:
- Maximum permitted DoD: A limit set for the product and its intended use.
- Measured DoD: What has happened. A current reading of 50% doesn’t prove that the battery is designed to reach that point every day.
When comparing battery depth of discharge, ask what each value is based on. One display may use the charge the battery can hold today. A datasheet may use its rating when new. An old battery can show full charge yet hold less energy than it once did.
A partial cycle needs a starting point
Hypothetical example: Alex checks a 100 Ah battery that starts the evening at 90% charge. Their monitor records 60 Ah withdrawn by morning, using the same 100 Ah reference throughout. The ending state of charge is 30%, and DoD below full is 70%.
That evening’s discharge swing was 60 percentage points. Alex adds the start and end values to the worksheet. The result makes clear that the battery did not begin full.
This distinction makes battery depth of discharge useful for operating logs. Record both the starting SoC and the lowest SoC reached. A cycle life rating based on full-to-low use may not describe a partial cycle in the middle of the range.
How to calculate battery depth of discharge
Calculate withdrawn charge in ampere-hours
To find battery depth of discharge for a battery that begins fully charged:
DoD (%) = withdrawn charge (Ah) ÷ reference capacity (Ah) × 100
If you remove 60 Ah from a 100 Ah rating, battery depth of discharge is 60%. The remaining state of charge is 40% if both methods use the same basis.
Measure the charge drawn at the battery terminals:
- For a steady current, multiply amps by hours. A 10 A draw for 3 hours removes 30 Ah.
- For a load that changes, use a monitor that adds up current over time. Include every load drawing from the battery.
- Record the starting state of charge. One voltage reading alone doesn’t tell you how many ampere-hours have been used.
Before calculating battery depth of discharge, record how the battery was rated:
- Discharge rate: A lead-acid rating for a slow discharge may not hold at a high current.
- Temperature: Use data for the expected conditions, including the coldest period when backup is needed.
- End voltage: The test stops at a stated voltage. Your system may reach its own cutoff sooner.
Keep Ah and energy separate. Ampere-hours measure charge; watt-hours measure energy. Rated voltage times Ah gives an estimate of rated energy. To measure energy, you must track voltage as well as current over time.
Our battery capacity calculation guide explains those units and sizing inputs.
Estimate usable capacity within an operating window
For a first usable capacity estimate, use the upper and lower charge limits:
Battery-side usable capacity (kWh) ≈ reference energy (kWh) × (upper SoC − lower SoC)
For an illustrative 10 kWh battery, work through the limits:
- Set the upper charge level at 90% and the lower level at 30%. These are example settings, not a product recommendation.
- Write them as fractions: 0.90 and 0.30. Subtract the lower from the upper to get a 0.60 window.
- Multiply 10 kWh by 0.60. Estimated usable capacity is 6 kWh DC under these assumed conditions. This estimate does not yet include aging or conversion losses.
Convert that battery-side estimate to load energy in three steps:
- Use a stated one-way discharge efficiency. The assumed value here is 92%; it is not a Banatton rating.
- Multiply 6 kWh by 0.92. The result is 5.52 kWh AC before losses from other loads.
- Allow for controls, fans, and other system loads if the quoted efficiency leaves them out. Include aging and cold-weather effects separately.
Battery depth of discharge isn’t an efficiency figure. The window sets how much stored charge you plan to use. Efficiency sets how much of that energy reaches the load.
Check the supplier’s definition of usable capacity before applying this equation. If a quoted usable rating already includes the permitted discharge window, applying that window again would count the restriction twice. For sound battery depth of discharge calculations, label each input as nominal DC, usable DC, or delivered AC.
Lead-acid and lithium discharge limits
Lead-acid: follow the battery’s intended duty
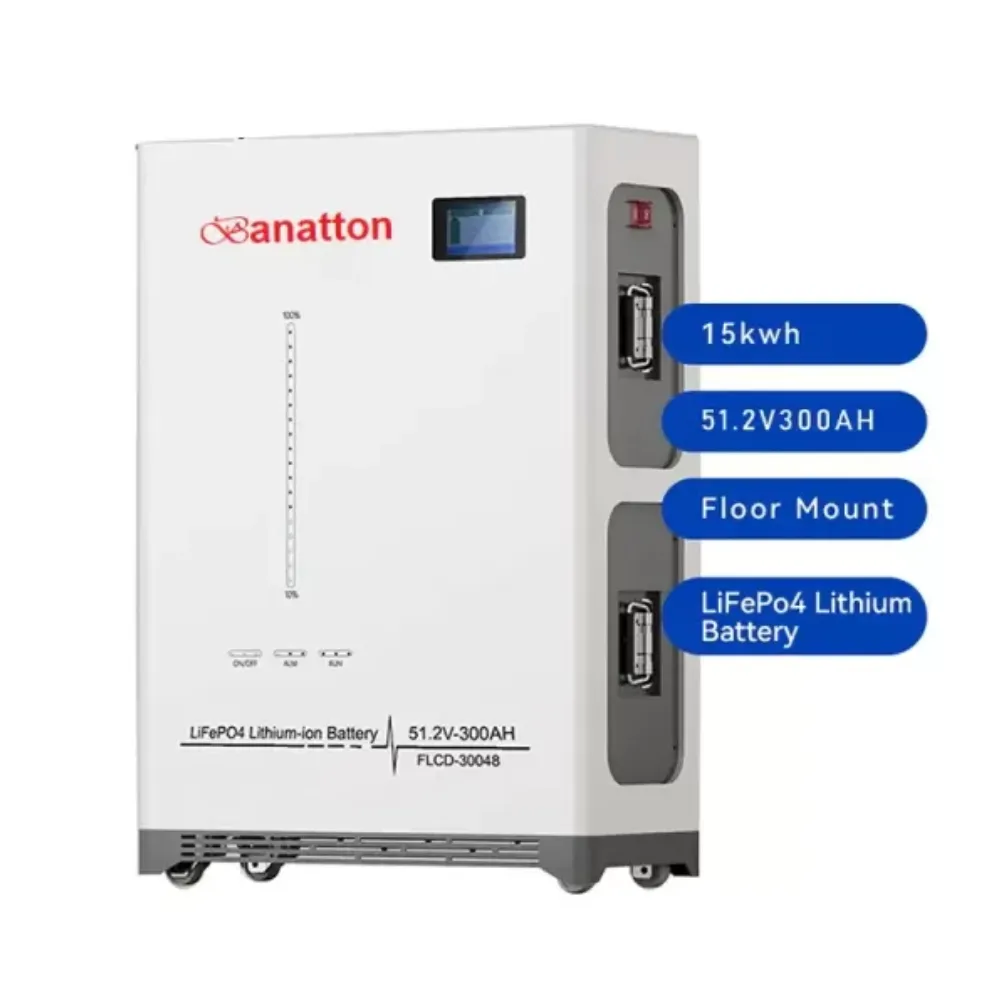
Trojan’s battery maintenance guidance recommends discharges of 50% or less and explains that shallower discharges support longer life. That is Trojan’s guidance. The limit for another lead-acid model can differ.
Battery depth of discharge should match the exact battery’s approved use. A standby UPS battery and a battery intended for repeated deep cycling need different performance evidence. Sealed batteries need their own charge settings. Don’t use flooded-battery care methods on a sealed product.
Avoid leaving a lead-acid battery deeply discharged. Follow its recharge instructions after use, and assess whether the charger can restore the required reserve before another outage. Good cycle life depends on how you charge and use the battery, as well as how deeply you discharge it.
Lithium: compare a specific series and endpoint
Lithium iron phosphate (LiFePO4) is a lithium-ion chemistry. Its name alone doesn’t set the right battery depth of discharge. Check the battery and system manuals for their allowed range and cycle life data.
For a concrete comparison, Victron’s LFP-Smart technical data lists these cycle-life values:
| Discharge depth | Stated cycles | Retained-capacity endpoint |
|---|---|---|
| 80% DoD | 2,500 | At least 80% of nominal capacity |
| 70% DoD | 3,000 | At least 80% of nominal capacity |
| 50% DoD | 5,000 | At least 80% of nominal capacity |
Read the table with its scope in mind:
- These cycle life figures belong to Victron’s LFP-Smart family. They are not Banatton ratings or a warranty for other batteries.
- The cycle life rows do not state the test temperature. Ask for that detail before comparing results from another supplier.
- The endpoint is a loss of capacity, not a sudden stop. Plan the usable capacity you need as the battery ages.
A battery management system (BMS) helps protect the pack. Its low-voltage shutdown shouldn’t be your daily target. Battery depth of discharge planning should leave room above shutdown. Match the settings in the battery, charger, and inverter.
Cycle life, throughput, and backup reserve
More cycles don’t automatically mean more lifetime energy
Cycle life describes repeated operation until a stated endpoint under particular conditions. A shallow cycle uses less energy each time. A higher cycle count alone may not be the better buy.
Consider battery depth of discharge, lifetime energy delivered, and aging with time together. Equivalent full cycles are one way to count use. Two discharges of 50% of the same capacity add up to one full discharge equivalent. That sum doesn’t mean the two patterns cause the same wear or cycle life.
Battery University’s review of lithium battery aging explains that discharge depth, charge range, temperature, and time all affect life. Its examples span particular cell types and test conditions. Don’t turn an illustrative cycle count into a predicted replacement date for your installation.
Ask for two distinct life estimates:
- Cycle life: Repeated use under stated charge and discharge conditions. Battery depth of discharge is part of that evidence.
- Calendar life: Aging with time, including periods on standby. A battery can lose capacity even when it rarely supplies the load.
Compare both with your expected use. One figure alone leaves part of the duty unexplained.
Match battery depth of discharge to the energy task
Hypothetical example: Morgan plans a system with 20 kWh of reference energy and a daily requirement of 10 kWh at the battery terminals. A 50% window gives an initial usable capacity estimate of 10 kWh. An 80% window gives 16 kWh.
Morgan’s spreadsheet shows that the smaller window only just meets today’s need. There is no room for capacity loss. They request an aging allowance and a separate outage reserve before choosing the system, instead of relying on cycle life alone.
The decision changes if the 10 kWh need is measured on the AC side. Conversion losses must then be included, so usable capacity at the battery terminals needs to exceed the load energy.
For daily storage, choose battery depth of discharge around the energy schedule and reserve requirement. For standby duty, check the outage duration and recharge time. In both cases, cycle life must be evaluated against the actual operating pattern.
Apply the limit to UPS and storage selection
Use discharge curves for short UPS runtimes
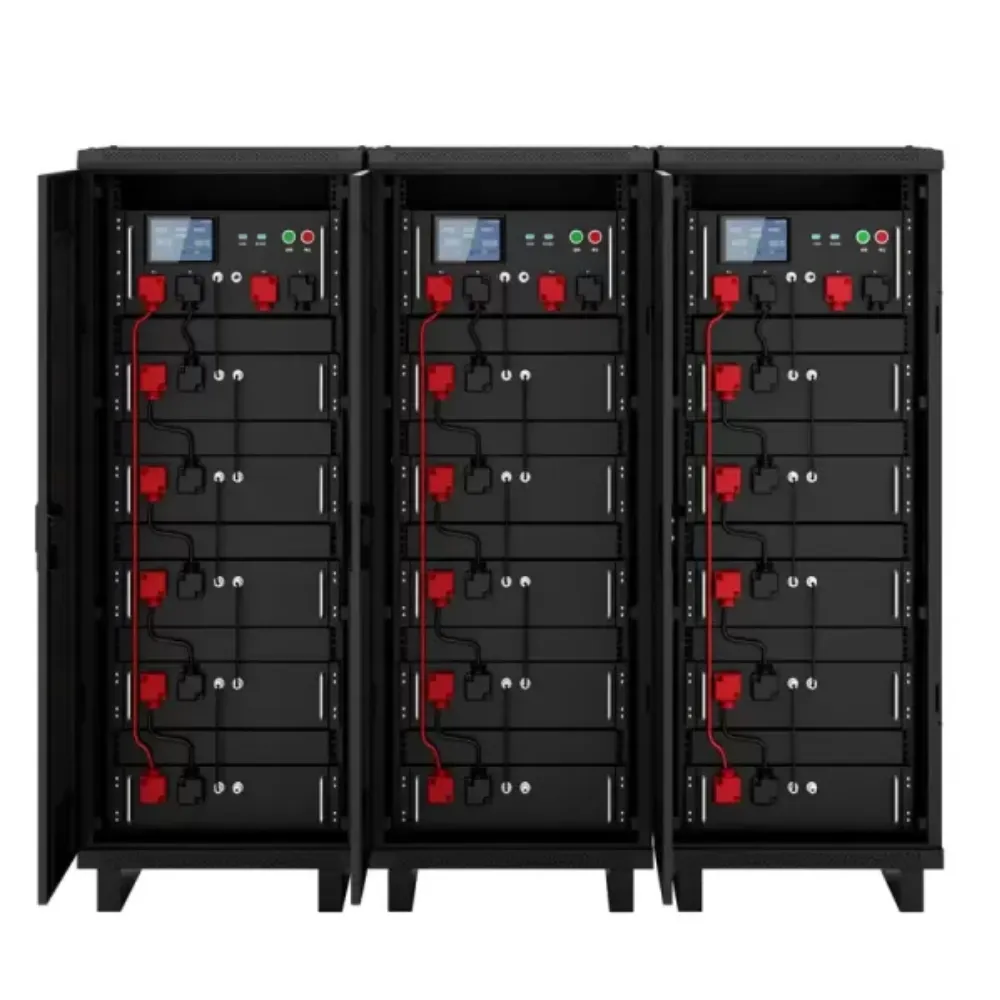
An energy estimate helps you define the need. It doesn’t prove that a UPS battery setup will work. High current, falling voltage, cold, and age can reduce usable capacity before the system reaches its cutoff.
Use battery depth of discharge beside the maker’s discharge data:
- For the required runtime, ask for power or current ratings at the end voltage used in the design.
- Match those ratings to the UPS load and its efficiency at that load. Check peak demand as well as normal use.
- Confirm the allowed battery setup, series count, and charger limits. A larger Ah label alone doesn’t establish compatibility.
A nominal Ah rating alone cannot prove that a battery will support a 10-minute duty. Our guide to UPS runtime and discharge curves explains how to connect the energy estimate with those performance checks.
Also check how the monitor finds and resets state of charge. A displayed percentage is useful for monitoring, but alarms, cell limits, and load shutdown must follow the equipment documentation. Don’t change protective thresholds simply to obtain a lower displayed percentage.
Ask suppliers for the complete operating basis
Before selecting a model, request these inputs together:
- Capacity reference: nominal and usable capacity, rating conditions, and the DC or AC measurement boundary.
- Operating window: upper and lower state of charge, allowed daily discharge, and emergency reserve rules.
- Power limits: continuous and peak output, discharge duration, cutoff voltage, and temperature limits.
- Life evidence: cycle life at the proposed window, retained-capacity endpoint, and calendar-aging assumptions.
- Recovery: charging profile, permitted charge current, and recharge time while supporting the load.
- Written terms: model-specific warranty, exclusions, and any cycle or throughput limits.
Use the controls documentation to settle three reserve questions:
- What is held back? A minimum state of charge can preserve energy for an outage. Record the setting and the energy it represents.
- When can you use it? Check which grid or system conditions release that energy to the load, and which limits still apply.
- Has it already been deducted? Read the supplier’s usable capacity definition before subtracting another reserve from the same figure.
If battery depth of discharge reaches its floor early, check the load, charge estimate, cold, and battery health. Lowering the reserve can hide the cause. It may still leave too little usable capacity for the required runtime.
Comparing battery options? Review Banatton storage batteries, then request the exact model’s discharge data and operating limits. Banatton Group lists lead-acid and lithium batteries. Check the fit and ratings for the chosen system.
Depth of discharge questions
What does 80% depth of discharge mean?
It means 80% of the stated capacity reference has been used, leaving 20% state of charge on that same basis. For a 100 Ah rating starting full, that means 80 Ah used. Use battery depth of discharge at this level only if the product permits it.
What does 30% DoD mean?
It means 30% of the reference capacity has been used from full, leaving 70%. It doesn’t mean 30% remains. For a partial cycle, state the start and end charge levels too. The change during that cycle can differ from its ending DoD below full.
Can LiFePO4 batteries be fully discharged?
Follow the battery and system documentation rather than a chemistry-wide rule. A system displaying 0% can still retain a protected internal reserve. That does not permit discharging cells below their limits or bypassing the BMS. Routine battery depth of discharge should stay within the approved operating window.
How do I calculate DoD if the battery didn’t start full?
Track the starting state of charge and subtract the charge withdrawn on the same reference basis. Starting at 90% and withdrawing 60% of that reference leaves 30% charge. Ending DoD below full is 70%, while the event’s discharge swing is 60 percentage points.
Should I multiply a usable kWh rating by DoD again?
Only if that usable-capacity definition hasn’t already included the discharge restriction. Ask the supplier where usable capacity is measured and what limits it includes. Applying battery depth of discharge twice understates usable capacity; omitting a restriction from a nominal rating overstates it. The label alone doesn’t settle which method you need.
Choose a discharge window that supports the load
Start with the energy and runtime your equipment needs. Then set the capacity basis, charge window, and point where energy is measured. Battery depth of discharge becomes useful when those inputs are clear and match across quotes.
Keep three checks together:
- State of charge: What remains on the chosen basis.
- Usable capacity: What the allowed window can supply under stated conditions.
- Cycle life: Repeated use to a stated endpoint. Heat, cold, age, and charging still affect the result.
For UPS duty, check the final setup against discharge data at the planned load and runtime. For daily storage, include conversion losses, an aging allowance, and a defined outage reserve. Recheck the requirement when loads or operating schedules change.
To discuss a battery depth of discharge requirement, send Banatton your load and runtime requirements with the proposed voltage, chemistry, temperature range, and reserve settings. Ask for the exact model’s documents. Base your choice on the energy your system needs to deliver.